Key Takeaways
Tracking the right business app KPIs means focusing on a small set of metrics tied directly to your operational goals rather than monitoring every number available.
- Focus on ten to twelve core KPIs aligned with your app’s current stage and primary business objective rather than tracking every available metric, which creates noise and slows decisions.
- Define what your app was built to solve before selecting any metric; your KPIs should measure how far the system has moved you away from the operational frustrations that existed before launch.
- Technical performance is a foundation metric: industry benchmarks set app stability at a 99.95% crash free session rate for Android and 99.87% for iOS, and poor performance directly reduces team retention of the tool.
- Low software adoption is usually a design or onboarding signal rather than team resistance; structured conversations between your development partner and team leads can identify where the experience breaks down.
- Workflow efficiency metrics like automation rate and time saved per process are best reviewed at regular intervals tied to product update cycles so that meaningful trends become visible and reactive decisions are avoided.
If you have built or commissioned a custom business app, you already know the investment is significant. What often surprises business owners at the growth stage is how quickly the question shifts from “does this work?” to “how do we know it’s working?” Knowing what KPIs to track in a business app is not just a technical exercise. It is the difference between running a system that quietly scales your operations and managing a tool that slowly becomes another layer of overhead your team works around.
This guide is written for business owners who are past the startup phase, leading teams of ten or more, and looking for a clear framework to measure whether their custom app is genuinely removing friction or just adding digital complexity. Whether you are running a growing operation in Vancouver’s tech corridor, managing field teams across the Lower Mainland, or scaling a service business from North Shore to Surrey, the goal is the same: identify the right metrics for your specific workflow, team, and growth stage, without overwhelming you with a catalogue of numbers.
Table of Contents
Why Most Business App KPIs Miss the Point
The instinct to track everything is understandable. Dashboards feel productive, and data feels like control. But multiple sources consistently point to one pattern: tracking too many KPIs at once is counterproductive. Most frameworks recommend focusing on ten to twelve core metrics aligned with your app’s current stage and primary business objective. When you try to monitor fifty metrics across every corner of your platform, you end up with noise rather than signal, and leadership decisions get slower rather than faster.
The real problem is not a lack of data. It is a lack of prioritization. Most business app KPI lists are designed for product managers at software companies, not for business owners who built a custom tool to solve a specific operational problem. Your app exists to serve your workflow, not the other way around. That reframe changes everything about how you approach measurement. Fewer, sharper metrics that connect directly to your business outcomes will always outperform a bloated dashboard that nobody actually reads before the Monday meeting.
Define What Your App Needs to Prove Before Choosing Any Metric
Before you select a single metric, define what your app was built to solve. Was it meant to reduce manual data entry errors? Cut the time your team spends handing tasks between departments? Replace five disconnected tools with one unified view? Each of those goals produces a different set of meaningful KPIs. If you track adoption rates when your real problem is process cycle time, you will miss the signals that matter and act on ones that don’t.
Think about the operational frustrations that existed before the app launched. Those frustrations are your baseline. Your KPIs should measure how far the system has moved you away from that baseline. This is where the SMART framework becomes genuinely useful: every metric you choose should be specific, measurable, achievable, realistic, and time-bound, not just a number that looks good on a screen.
How to Map KPIs to Operational Goals
Each KPI in your dashboard should map directly to a specific bottleneck or growth ceiling your app was designed to remove. If your app was built to consolidate approvals across departments, your primary metric might be approval cycle time. If it was built to replace manual reporting, you would track time saved per process and error frequency before and after adoption. This one-to-one alignment between metrics and goals keeps your dashboard honest and makes it far easier to act on what you see. When a number moves, you will know exactly what it means for the business, not just for the software.
| Operational Goal | Primary KPI to Track | Baseline to Capture Before Launch |
|---|---|---|
| Reduce manual data entry errors | Error frequency | Error rate per process pre-launch |
| Speed up cross-department approvals | Approval cycle time | Average approval turnaround time pre-launch |
| Replace manual reporting | Time saved per process | Time spent on reporting tasks pre-launch |
| Consolidate disconnected tools | Feature engagement rate | Number of tools in active use pre-launch |

The Core KPIs Worth Tracking in a Business App
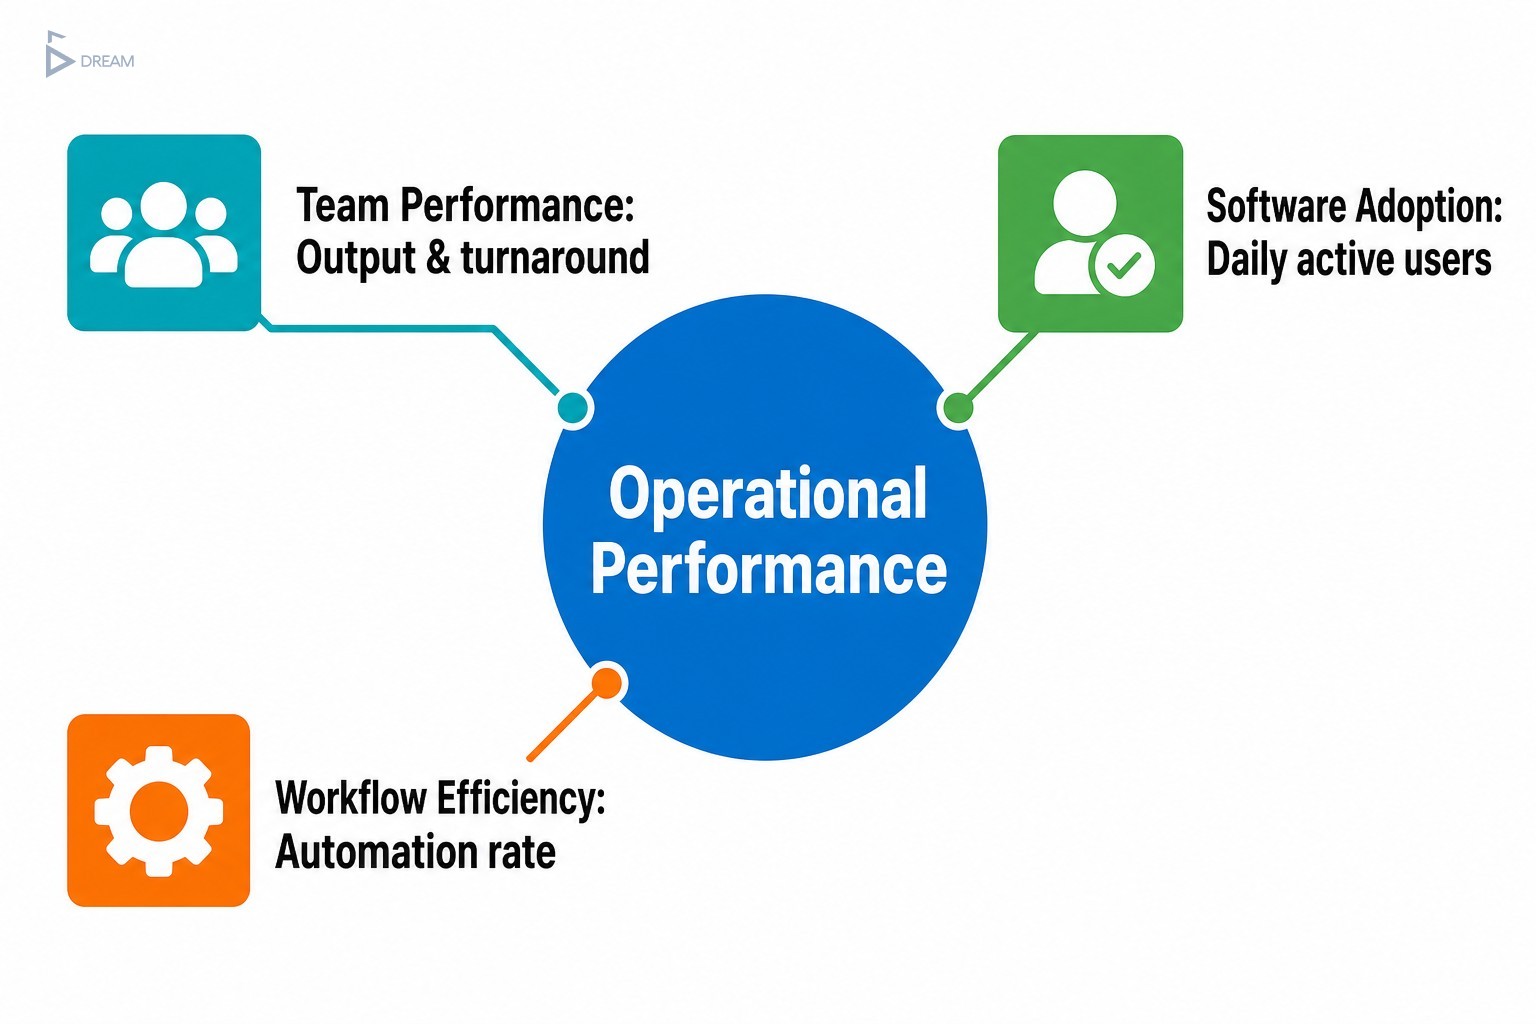
Not every metric deserves a place on your dashboard. The ones that do fall into four practical categories: operational performance, team productivity, software adoption, and workflow efficiency. Here is what each category should cover.
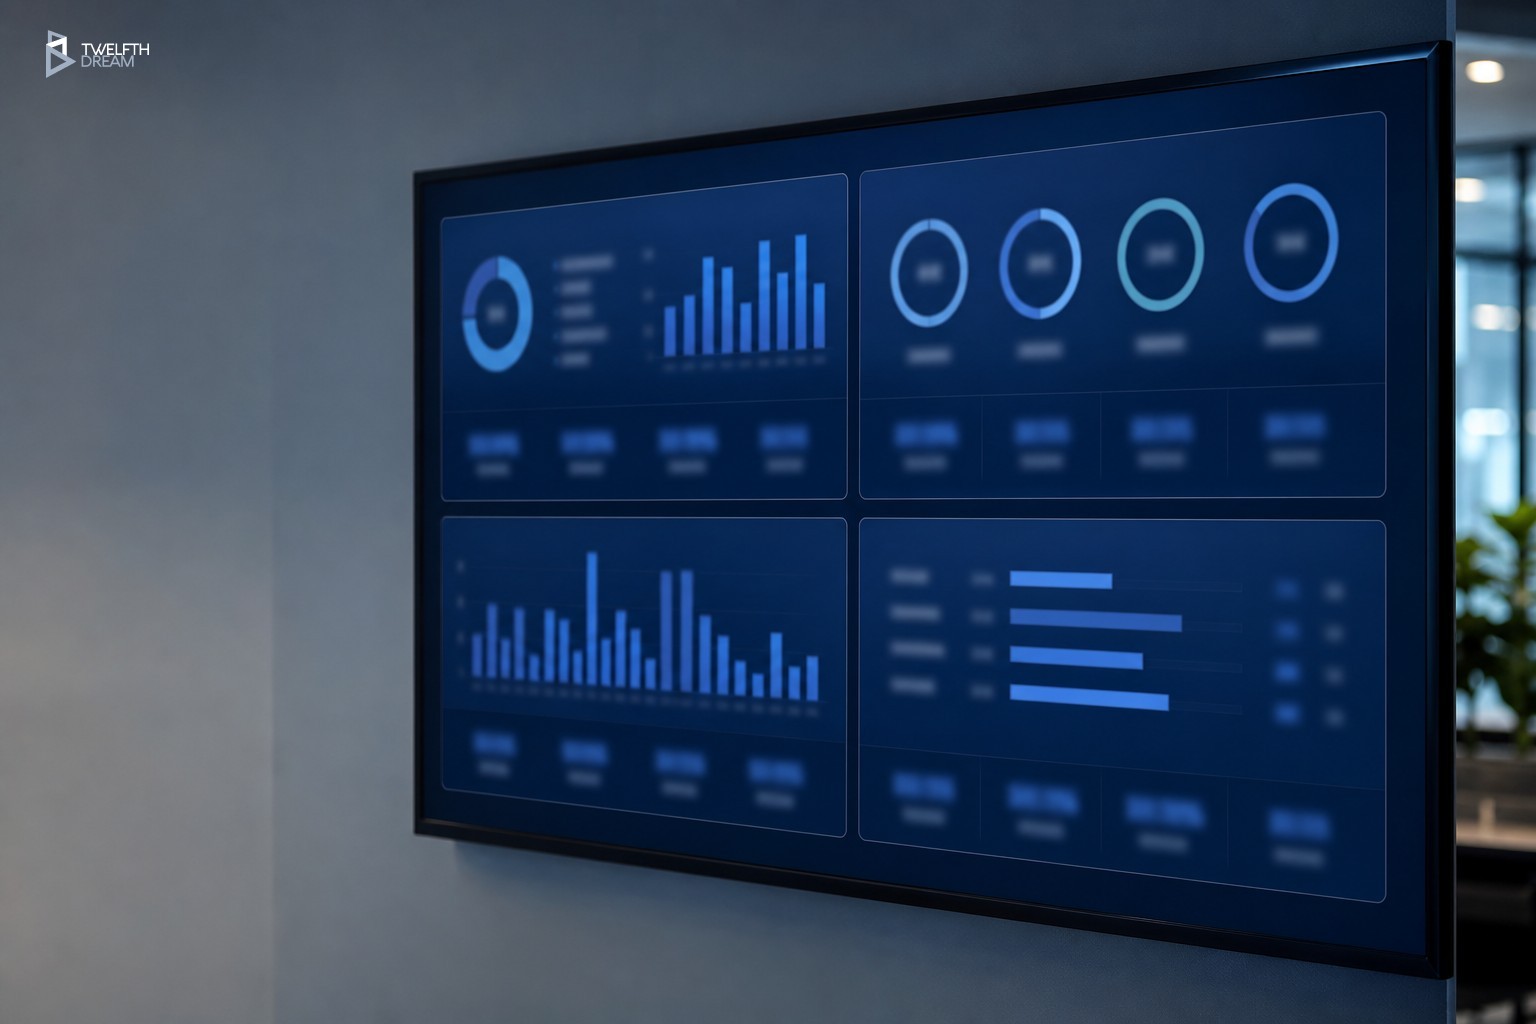
Operational Dashboard Metrics
The most effective operational dashboards are built around a small set of metrics that reflect real work rather than system activity. The key ones to watch are:
- Task completion rate: Are your team members closing out work inside the platform, or finding ways around it?
- Process cycle time: How long do core workflows take from start to finish?
- Error frequency: Are operational mistakes going down since the app launched, or have new ones appeared?
- App stability: Industry benchmarks sit at 99.95% crash-free sessions for Android and 99.87% for iOS. If your app falls below these, every other metric you track is being compromised at the source.
When exploring custom dashboard ideas for business data, the consistent finding is that three to five critical numbers at a glance, the ones your leadership team needs to make daily decisions, should sit front and centre. Everything else belongs in a deeper reporting layer. Understanding how dashboards improve decision making starts with this separation: when leaders can find the right information immediately, they decide faster and with more confidence.
Team Performance Metrics
Team performance metrics inside a custom app should reflect productivity, accountability, and collaboration, without veering into micromanagement. Useful starting points include:
- Output per user: What is each team member actually completing inside the system?
- Task turnaround time: How quickly are individual tasks being resolved from assignment to completion?
- Escalation rate: How often do tasks move up the chain rather than being handled at the right level?
The most effective team-level KPIs are ones the team itself can see and act on. When an individual contributor can look at their own turnaround metrics and understand where delays are happening, they become an active participant in improving performance rather than a subject being monitored. This design philosophy aligns directly with building tools your team wants to use, not tools they feel obligated to log into.
Software Adoption Metrics
Software adoption metrics are often the first sign that something is either working well or quietly failing. The clearest early indicators are:
- Daily active users: What proportion of your team is logging in on a given day?
- Feature engagement rate: Which parts of the app are being used, and which are being ignored?
- Session frequency and length: Research from Adjust shows typical session lengths range from 6.55 to 28.62 minutes depending on app category. For internal business tools, unusually short or infrequent sessions often point to a friction problem rather than a disengagement problem.
Low adoption is frequently misread as team resistance. In most cases, it is a design or onboarding signal. If users are not engaging with a feature, it is worth asking whether it is easy enough to find, whether it was explained clearly during rollout, and whether it actually maps to how the team works day to day. When adoption numbers stall, the right response is not a mandate to use the system. It is a structured conversation between your development partner and your team leads to identify where the experience breaks down.
Workflow Efficiency Metrics
Workflow efficiency metrics sit at the heart of why most growing businesses invest in a custom app. The most telling ones are:
- Automation rate: What percentage of repeatable tasks is the system handling without manual input?
- Manual override frequency: How often are team members bypassing automated steps?
- Time saved per process: Compared to your pre-launch baseline, how much time is each workflow saving?
These metrics are only meaningful when you have a baseline to compare against, which is why capturing pre-launch data is one of the most important steps in any custom app project. They are also better reviewed at structured intervals tied to your product update cycles, rather than monitored in real time. A drop in automation rate over three months tells you something actionable. A single day’s anomaly tells you very little.
| KPI Category | Key Metrics | Primary Question Answered |
|---|---|---|
| Operational Performance | Task completion rate, process cycle time, error frequency, app stability | Is the app reflecting real work accurately? |
| Team Performance | Output per user, task turnaround time, escalation rate | Is the team working effectively through the app? |
| Software Adoption | Daily active users, feature engagement rate, session frequency and length | Is the team actually using the app? |
| Workflow Efficiency | Automation rate, manual override frequency, time saved per process | Is the app delivering measurable operational results? |
Building Review Checkpoints Into Your App’s Growth Plan
Regular metric reviews, aligned with your product update schedule, give you a structured moment to ask whether the app still reflects how your business operates. Teams evolve, workflows shift, and features that were critical at launch sometimes become irrelevant while new gaps emerge. A quarterly review checkpoint creates a natural trigger to add functionality, retire unused modules, or adjust how the dashboard surfaces data.
For Vancouver businesses navigating rapid growth, whether you are expanding headcount in Gastown, opening additional locations across Metro Vancouver, or integrating remote teams working across BC, this rhythm is especially valuable. It is not a sign that the original build was wrong. It is a sign that your business is growing, and your tools should grow with it.
When Your KPIs Stop Making Sense
There are clear signals that you need outside input on your KPI strategy. The most common one is conflicting metrics: when your task completion rate looks healthy but your team is still reporting delays, the disconnect usually means the app is not capturing the full picture of how work actually flows.
Before acting on any metric trend, verify three things:
- Is the app capturing data correctly? A reporting error looks exactly like a performance problem until you trace it to the source.
- Has team behaviour genuinely changed? A metric shift can reflect a new workaround your team has adopted rather than a real improvement.
- Do the original operational goals still apply? Businesses at the scaling stage change direction faster than their tools do. KPIs that were well designed eighteen months ago may now be measuring the wrong outcomes entirely.
At Twelfth Dream, we build custom apps for Vancouver businesses from concept through to long-term support, which means we stay close to how your platform performs well after launch. If your current metrics are telling a story that does not match what you see on the ground, or if you are ready to build a system with the right measurement layer built in from day one, we would love to talk. Reach out to our team and let’s turn your operational vision into a tool your business can grow with.
Frequently Asked Questions About Business App KPIs
How many KPIs should a business app track at once?
Most frameworks recommend ten to twelve core KPIs aligned with your app’s current stage and primary business objective. Tracking more than that creates noise rather than insight and slows down decision-making. Start with the metrics that directly reflect your original operational goals, then expand the dashboard as those goals evolve.
What is the difference between software adoption metrics and workflow efficiency metrics?
Adoption metrics measure whether your team is using the app: login frequency, feature engagement, and session length. Workflow efficiency metrics measure whether the app is delivering results: automation rate, time saved per process, and manual override frequency. Both matter, but they answer different questions and should be reviewed separately.
Why is capturing pre-launch data so important for measuring app performance?
Without a pre-launch baseline, you have no reference point for improvement. Metrics like time saved per process or error frequency are only meaningful when compared against how the same work was done before the app existed. Capturing baseline data before go-live is one of the most practical steps in any custom app project.
What does low software adoption usually indicate?
Low adoption most often signals a design or onboarding issue rather than team resistance. If users are not engaging with a feature, examine whether it is easy to find, whether it was clearly explained during rollout, and whether it aligns with how the team actually works. The right response is a structured review with your development partner, not a usage mandate.
How often should a Vancouver business review its app KPIs?
Quarterly reviews tied to your product update cycle work well for most growing businesses. This cadence gives enough time for trends to become meaningful while still allowing timely adjustments. Businesses scaling quickly, such as those adding headcount, new locations, or remote teams, may benefit from more frequent check-ins during periods of rapid change.